Caps, Floors and Collars

Caps, Floors and Collars are option based interest rate risk management products that put limits to the interest rates. A barrower may want to limit the interest rate to avoid any rises in the future and buys a cap. Or investor may buy a floor to avoid any future falls in the interest rates. Anyone who aims to maintain interest rates within defined range can use the combination (collar).

Given the £50 million loan over 2 years period we can make speculation how cap, floor and collar would make a difference. We assume that interest rate rises .5% each quarter in 2 years, starting from 2%. A company would like to buy “cap” at 4% for hedging purposes costing £100,000. Table 1 would show hedged payments for such a scenario.


Quarters Assumed
LIBOR
Interest due
[ (LIBOR) x (1/4) x 50M ]
Cap Payoff
[ MAX(LIBOR- 0.04,0) x (1/4) x 50M ]
Hedged Interest Payment Hedged Rate
1/8 2%   -100,000    
2/8 2.5% 250,000 0 250,000 2%
3/8 3% 312,500 0 312,500 2.5%
4/8 3.5% 375,000 0 375,000 3%
5/8 4% 437,500 0 437,500 3.5%
6/8 4.5% 500,000 0 500,000 4%
7/8 5% 562,500 62,500    500,000 4%
8/8 5.5% 625,000 125,000 500,000 4%
    687,500 187,500 500,000 4%
Table 1 – Interest rate cap example

As seen from the table even if the interest keeps rising above the 4% level, company is only liable to pay £500,000 and its hedged rate is just limited to 4%. Company pays a premium of £100,000 at the beginning but then in the last 3 quarters the hedged payments payoffs.

Similar to the example above, a loaner may want to use “floor” to establish minimum rate. This would let the loaner lock the minimum rates while benefiting with higher returns if rates increase.  A floor agreement might be held at 4%, costing £100,000. The result of cash flows would be something like in table 2.

Quarters Assumed
LIBOR
Interest received
[ (LIBOR) x (1/4) x 50M ]
Floor Payment
[ MAX(LIBOR- 0.04,0) x (1/4) x 50M ]
Hedged Interest Payment Hedged Rate
1/8 2%   -100,000    
2/8 2.5% 250,000 0 250,000 2%
3/8 3% 312,500 187,500 500,000 4%
4/8 3.5% 375,000 125,000 500,000 4%
5/8 4% 437,500 62,500 500,000 4%
6/8 4.5% 500,000 0 500,000 4%
7/8 5% 562,500 562,500 4.5%
8/8 5.5% 625,000 0 625,000 5%
    687,500 0 687,500 5.5%
Table 2 – Interest rate floor example

By using floor, company is able to lock its minimum hedged rate at 4% for the 2nd 3rth and 4th quarters, while receiving higher rates later. Initial £100,000 floor premium payoffs later as hedged interests received.

There is also another way of hedging the borrowed loan using “collar”. If the borrower wants to put maximum limit to its interest rate, cap would do the work. Borrower has to pay the premium for this service. However, even this premium can be avoided by selling floor and receiving floor premium. Selling a floor will bring the obligation of payment, if the rates fall below the agreed level, but borrower itself also benefits from the lower interest rates. Suppose our company buys a cap at 5% costing £100,000 and sells a floor at 3% receiving £80,000. Table 3.3 shows hedged cash flows for such scenario. 

Quarters Assumed
LIBOR
Interest due
[ (LIBOR) x (1/4) x 50M ]
Floor Payment
[ MAX(LIBOR- 0.04,0) x (1/4) x 50M ]
Cap Payoff
[ MAX(LIBOR- 0.04,0) x (1/4) x 50M ]
Hedged Interest Payment Hedged Rate
1/8 2%   80,000 -100,000    
2/8 2.5% 250,000 0 0 250,000 2%
3/8 3% 312,500 -62,500 0 375,000 3%
4/8 3.5% 375,000 0 0 372,000 3%
5/8 4% 437,500 0 0 437,000 4%
6/8 4.5% 500,000 0 0 500,000 4.5%
7/8 5% 562,500 562,500 5%
8/8 5.5% 625,000 0 62,500 562,500 5%
    687,500 0 125,000 562,500 5%
Table 3 – Interest rate collar example

As seen from the table, borrower is already reducing its premium costs to £100,000-£80,000 = £20,000 buy selling floor and also limiting its interest costs at 5% when interest rate rises above the cap level. The obligation of floor payments would not really bother the borrower, since it is also taking advantage of direct borrowing from lower interest rates.

Options in Finance

Options are financial instruments that convey the right, but not the obligation, to engage in a future transaction on some underlying security. For example, buying a call option provides the right to buy a specified quantity of a security at a set strike price at some time on or before expiration, while buying a put option provides the right to sell. Upon the option holder's choice to exercise the option, the party who sold, or wrote, the option must fulfill the terms of the contract.

In short option types can be summarized as follows:

  • A Call Buyer acquires the right to buy stock at exercise price.
  • A Put Buyer acquires the right to sell the stock at exercise price.
  • Long is the buying of a stock, with the expectation that the asset will rise in value.
  • Short is the selling of a stock, with the expectation that the asset will fall in value.
The basic trades of traded stock options

These trades are described from the point of view of a speculator. If they are combined with other positions, they can also be used in hedging.

Long Call

A trader who believes that a stock's price will increase might buy the right to purchase the stock (a call option) rather than just buy the stock. He would have no obligation to buy the stock, only the right to do so until the expiration date. If the stock price increases over the exercise price by more than the premium paid, he will profit. If the stock price decreases, he will let the call contract expire worthless, and only lose the amount of the premium. A trader might buy the option instead of shares, because for the same amount of money, he can obtain a larger number of options than shares. If the stock rises, he will thus realize a larger gain than if he had purchased shares.

Short Call

A trader who believes that a stock price will decrease, can short sell the stock or instead sell a call. The trader selling a call has an obligation to sell the stock to the call buyer at the buyer's option. If the stock price decreases, the short call position will make a profit in the amount of the premium. If the stock price increases over the exercise price by more than the amount of the premium, the short will lose money, with the potential loss unlimited.

Long Put

A trader who believes that a stock's price will decrease can buy the right to sell the stock at a fixed price (a put option). He will be under no obligation to sell the stock, but has the right to do so until the expiration date. If the stock price decreases below the exercise price by more than the premium paid, he will profit. If the stock price increases, he will just let the put contract expire worthless and only lose his premium paid.

Short Put

A trader who believes that a stock price will increase can buy the stock or instead sell a put. The trader selling a put has an obligation to buy the stock from the put buyer at the put buyer's option. If the stock price increases, the short put position will make a profit in the amount of the premium. If the stock price decreases below the exercise price by more than the amount of the premium, the trader will lose money, with the potential loss being up to the full value of the stock.

Examples

1. A buyer of a call option expects the price of the stock to rise. It must be worthwhile to pay the premium price, for the stock appreciation payoffs at the end of the maturity.  Given the strike price of 30p and call premium at 1.5p, the profit and loss graphic would be as follows:

image
At the time of exercising the option, anything that is above spot price + premium (30p + 1.5p) would yield in profit. And if stock value falls below the spot price then the loss will be limited to the premium price paid.

2. Seller (writer) of a put option has the obligation to buy the stock at the exercise price. The profit and loss profile graphic would be as follows for the strike price at 30p and premium put option price 2p.

image

As seen from the graphic the profit for a put writer is limited to 2p. However if the stock price at maturity time is below the spot price then seller of the put has to buy the stock at predetermined strike price. The loss may be as much as the price of the stock if its value falls to zero. Therefore it is the riskiest option among the other types. Seller of the put has to have a strong feeling that stock price will not fall or at least remain stable until the end of maturity.

3. Following graph illustrates the profit and loss profile by combining buyer of call and put options.

image

The sole buyer of a call option would start making profit after spot price + call premium (30p + 1.5p); whereas the sole buyer of put option would make profit if the stock price falls below the spot price – put premium (30p – 2p).  The profit and loss profile of buyer of both would look like something as follows:

image
The maximum loss would be at spot price, when no change occurs at the stock value. This would be the sum of call and put option premiums. Any change from this point would start accumulate profit. If the Stock price exceeds 33.5p or falls below 26.5p, buyer would be able to avoid loss. Therefore any trader who buys combination of put and call option must expect swings in any direction. Stable stocks would not make much of a profit.

References

1. http://en.wikipedia.org/wiki/Stock_option

Porter’s Three Generic Strategies

Selection of an effective strategy for a company in its environment is very important. The first successful taxonomy of strategies was done by Porter in 1980. He identified three generic strategies that a business can employ: overall cost leadership, differentiation, and segmentation (or focus).

Overall Cost Leadership

This strategy is based on the effective cost control and marketing products and services based on price. There are obvious benefits of this strategy:

1) Business can make higher returns by charging equal to or lower than market average by means of its lower costs.

2) It allows business to increase its market share by keeping its prices lower than its competitors.

3) It allows the business to enter a new market by charging lower prices than hosting competitors.

4) It gives valuable advantage in the market where consumers are price sensitive.

5) It helps a business to create a barrier for other companies who are willing to enter the market.

Tesco, as the biggest retailer company in the UK, has managed to utilize this strategy aggressively in recent years and gained the biggest market share over among its competitors, in spite of its late entry to the market.

Differentiation

A differentiation strategy is based on achieving a competitive advantage by creating products and services that are perceived by customers to be unique and superior. A differentiated company can charge premium price which is above the market average and makes higher returns, rather than reducing costs. World known companies like Mercedes and Rolex exemplifies this strategy. The products of both companies are perceived as prestigious enough to pay by its consumers. The benefits of this strategy are as follows:

1) They have the privilege to charge above average prices.

2) The demands for their products are less dependent on their prices

3) They can make higher returns by charging higher than their competitors

4) They create a barrier for other companies who are willing to enter the market.

Segmentation

In this type of strategy, companies focuses on particular market segment or consumer base rather than whole market. Consumer base may be identified on their age, income, lifestyle, sex, geography etc. Within this particular segment, company may employ either cost leadership or differentiation strategy. Major benefits are:

1) Companies don’t have to allocate big resources to meet demands for whole market.

2) It gives the opportunity of specialization and greater knowledge for segment

3) It makes simpler for a company to enter a new market, which doesn’t have big resources.

A car manufacturer, Ferrari, employs this strategy by focusing on sports car market. It only produces high performance cars and charge well above prices than its competitors.

Company Mission

Strategic planning usually starts with determining the mission of the business, which identifies why it exists, clarifies of who it serves, and expresses of what it hopes to achieve. Although style and content of mission statements varies enormously, the basic questions that are addressed through missions are

What business are we really in?

What type of business do we want to be?

What is our target market?

What inspires us?

Following is a nice introduction of the mission statement of Nissan Motor Manufacturing Limited. In this statement, they clarify their business and targeting market along with their inspirations.

As a company we aim to build profitably the highest quality car sold in Europe. We want to achieve the maximum possible customer satisfaction and ensure the prosperity of the company and its staff.

To assist in this, we aim to achieve mutual trust and cooperation between all people within the company and make NMUK a place where long-term job satisfaction can be achieved. We recognise that people are our most valued resource and in line with this spirit believe that the following principles will be value to all…”

However mission statements do not necessarily need to be long and totally independent of the company’s size, type or success. Some other companies may choose simpler, shorter and very clear statements. Following is the mission statement of IBM Corporation.

Our goal is simply stated. We want to be the best service organization in the world.”

Although their statement was very brief, there are many people who believe that grand design voiced by former CEO Learson was primary reason for that great success of IBM.

By issuing mission statements, companies are able to communicate their objectives and values to the various stakeholders’ groups. They may even also influence behaviour and attitudes of employees, although this has been debated as anecdotal evidence suggests that many employees have not in fact read their organization’s mission statement.

Business Strategy - What is Strategy?

One of the mostly quoted definition for a strategy is “the determination of the basic long term goals and objectives, and the adoption of courses of action and the allocation of resources necessary for carrying out the goals”, which was offered by Chandler (1962). As it has been put in this definition, a strategy includes three main contents, which are determination of goals, adoption of courses of action and allocation of resources.

The strategy of a business should be clear at how the organisation will achieve its aims and objectives. The most important aims of an organisation are ‘to ensure that it survives’,’ to make it profitable’ and ‘to sustain its growth at a reasonable pace’. The strategic plan tries to find the optimum match between business’s resources and opportunities and takes into account how it will adapt in a changing competitive environment. The plan is based on careful analysis of the relative strengths and weaknesses of the company and an assessment of the opportunities in the markets open to it. This means that the strategic plan has to deal with intangibles like market opportunities and technological changes as well as tangibles like financial resources, personnel and supplies.

From the different aspects mentioned above we can summarise the main considerations of a strategy as follows:

1) Direction of the organisation.

2) Identification of business objectives

3) Type of growth

4) Management structure

5) Identifications of opportunities and threats in the market.

Gary Hamel and C.K Prahalad (1996) advocate that a critical ingredient in the strategies of outstandingly successful companies is what they term “strategic intent”. And at this point, business should determine its vision and mission. Company vision is the setting direction of a business and where it’s going to be in the future. Company mission outlines the purpose, reason for being and how the vision is to be translated into reality. Through vision and mission, business can set specific objectives.

Strategy Analysis

Once company clarifies its vision and mission, next step is to do strategic analysis. This activity includes conducting a scan or review of the organization’s environment. This environment can be political, social, economic or technical. Planners assess various driving forces in these environments and these driving forces are commonly defined as:

1. Competition from other businesses in the market place; this depends on factors such as market share and product differentiation;

2. The threat of competition from potential entrants to the market;

3. The power of the buyers

4. The power of the suppliers

5. Threats from substitute products

In light of these forces, planners look at company’s strengths, weaknesses, opportunities and threats (which is also known as SWOT analysis). After a careful valuation of company, planners come to conclusion about what the organization must do as a result of the major issues and opportunities facing the organization. These conclusions include what overall accomplishments (or strategic goals) the organization should achieve, and the overall methods (or strategies) to achieve those accomplishments. These are worded as much as possible to be realistic, timely, specific, and measurable.

Laying out how the strategic goals will be accomplished is called action planning. Action planning is about specifying objectives or results for each strategic goal. Therefore, meeting a strategic goal involves accomplishing set of objectives along the way. Action planning also includes specifying responsibilities and timelines against each objective. And it should also include techniques to monitor and evaluate the plan.

It’s now a common task for an organisation to develop an annual plan which includes strategies, objectives, responsibilities and timelines that must be achieved in the year ahead.

The planning model mentioned above is known as Mission and Issue Based strategic planning and it is most common method for planning strategies. However there are also other methods that can be more suitable for some organizations.

Organic Strategic Planning is one of the model which starts by articulating the organization's vision and values. It requires continual reference to common values, dialoguing around these, and continued adhesion to them to achieve goals. The key point is to use dialogue for clarification of organization’s values and vision and asking working groups to portray their strategic plans and what they are going to do to achieve their goals.

Another model is Scenario Based Planning which helps planners to ensure they are conducting a strategic thinking. It is about examining various external forces which might influence the organization such as regulations, demographic changes. For each of those forces, planners develop three different future organizational scenarios including best, worst and reasonable cases. And then, they suggest what organisation might do in response to these scenarios and select the most likely external change and reasonable strategy to effect organization.

Alignment Model is to ensure that organization is sticking its vision and mission. It is especially useful for companies that need fine tuning in their strategies and figuring out why they are not effective as expected. Planners identify what is working well and what is not. And then addresses to those that are not working and readjust their strategies to correct problems.

Income Taxes and Dividend Taxes

An income tax is a tax levied on the financial income of persons, corporations, or other legal entities. Various income tax systems exist, with varying degrees of tax incidence. Income taxation can be progressive, proportional, or regressive. When the tax is levied on the income of companies, it is often called a corporate tax, corporate income tax, or profit tax. Individual income taxes often tax the total income of the individual (with some deductions permitted), while corporate income taxes often tax net income (the difference between gross receipts, expenses, and additional write-offs).

The "tax net" refers to the types of payment that are taxed, which included personal earnings (wages), capital gains, and business income. The rates for different types of income may vary and some may not be taxed at all. Capital gains may be taxed when realized (e.g. when shares are sold) or when incurred (e.g. when shares appreciate in value). Business income may only be taxed if it is significant or based on the manner in which it is paid. Some types of income, such as interest on bank savings, may be considered as personal earnings (similar to wages) or as a realized property gain (similar to selling shares)

Tax rates may be progressive, regressive, or flat. A progressive tax taxes differentially based on how much has been earned. For example, the first $10,000 in earnings may be taxed at 5%, the next $10,000 at 10%, and any more income at 20%. Alternatively, a flat tax taxes all earnings at the same rate. A regressive income tax may tax income up to a certain amount, such as taxing only the first $90,000 earned.

Taxation of Small Business Profits

There has been loads of changes in the rates of taxation which small companies are liable to pay. As of the present day the rates are as follows:

Taxation for small businesses in UK since April 2006

Level of Profit Tax Rate
£0 to £300k 19%
£300k to £1.5m Marginal rate from 19% to 30%
£1.5m and above 30%
Income tax personal and age-related allowances
£ per year (unless stated) 2007-08
Personal allowance (age under 65) £5,225
Personal allowance (age 65-74) £7,550
Personal allowance (age 75 and over) £7,690

The government provides a ‘tax credit’ amounting to 10% of dividend income for shareholders, to take account of the fact that dividends are paid out of already taxed profits. So when your dividend is issued you will receive a statement showing both how much was paid and the tax credit due.There are two levels of tax on dividends. Basic rate taxpayers are taxed at 10%, which is covered by the tax credit issued, so there is no further tax to pay. Higher rate taxpayers pay 32.5%, minus the 10% tax credit, 22.5%.

Income tax rates in UK 2007-2008
Rate Tax Rate

Band (above any personal allowance)

Starting rate 10% 0 - £2,230
Basic rate 22% £2,231 - £34,600
Higher rate

40%

over £34,600
Dividend tax rates in UK 2007-2008
Dividend income that falls Tax rate
below the £34,600 level 10%
above the £34,600 level 32.5%

It is not uncommon for a controlling director to have a remuneration package that consists heavily of dividend payments. Dividend payments are distributed from the net profits of a limited company and are paid net of a 10% tax credit. If the shareholder is not a higher rate taxpayer after taking into account the gross dividend, then no further tax is due. If any part of the gross dividend falls within the higher rate tax band then income tax is levied at the rate of 22.5% on that part of the gross dividend.

At the end of the tax year, most small business owners pay 19% taxes on their profits and then receive the rest of the income in the form of dividend payments. This dividend then is not double taxed, if the dividend amount is below the higher dividend tax level (£34,600). The dividends which are below this rate do not require to be taxed again, however they require to be shown in the financial reports notionally.

Nothing is better than giving an example. So assume that there are two partners owning a company having a share 50% each and liable to pay taxes on £100K of profit at the end of the year. The amount of the tax they need to pay is 19K as it is under £300K. Then the rest can be shared as £40.5K each in the form of dividend, which requires to be taxed, since it is above the higher dividend tax rate. The amount they need to pay from this income is 22.5% of (£40.5K - 5.225K) = £7.93K.

Note: Marginal tax rate is the highest rate at which you pay it. In other words, if you are a basic rate taxpayer only, and you have sufficient unused basic rate band after taking into account all other income then you will pay tax at 22%. If you are a higher rate taxpayer then you will pay tax at 40%. You may find yourself paying some tax at 22% and some at 40%, ie if the additional taxable income exceeds what is left of your basic rate band.

References

1. http://www.jameshay.co.uk/KnowledgeBase/Features.aspx?id=89

2. http://money.scotsman.com/scotsman/articles/articledisplay.jsp?section=Tax&article_id=1040591

3. http://www.direct.gov.uk/en/MoneyTaxAndBenefits/Taxes/TaxOnSavingsAndInvestments/DG_4016453

4. http://en.wikipedia.org/wiki/Taxation_in_the_United_Kingdom

5. http://www.taxationweb.co.uk/forum/discuss.php?id=9304

Market Efficiency and Financial Managers

There are many technical analysts in the markets, trying to find best investments on securities by examining past prices, past earnings, track records and other indicators. However security prices are mainly based on investor expectations rather than their analysis. At this point, markets can be thought as efficient, under the condition of all available information is already reflected on security prices.

Efficient Market Hypothesis

"An 'efficient' market is defined as a market where there are large numbers of rational, profit-maximizers actively competing, with each trying to predict future market values of individual securities, and where important current information is almost freely available to all participants" (Euegene F. Fama cited in Investor Home, accessed 22nd April 2006). Fama's idea formed the entire basis for this hypothesis. His argument was that markets include many qualified and well informed investors who value the securities appropriately and the prices reflect all of the information about state of the companies which issue them. Therefore price levels do not follow any pattern and past experiences cannot be used to predict future prices.

It is clear that no market can attain full efficiency all the time. Changes in the share prices are always possible whether they are caused by newly disclosed information.

However; it will take time for investors to take action to this information and for share prices to get their actual value. Following two diagrams illustrates how share prices are responding in the real markets.

clip_image002


clip_image004

There are three forms of the efficient market hypothesis: weak, semi-strong and strong. Each sets different level of relation between the information and security prices.

The weak form

This form asserts that price movements are on a random basis and does not depend on the past events. In this form, prices are assumed to follow the "random walk". Therefore it is not possible to predict the future prices by looking at historical share prices.

Semi-strong form

This form asserts that any public information about a company is reflected in its share price. This means it is no use to dig into the company reports, announcements or industry trends to find information that would be used to make superior returns. We can anticipate that a market that is efficient in the semi strong form will incorporate the features of the weak form as well.

Strong-form

This advances semi strong form one step further and asserts that even insider information along with the public information is reflected in company shares. This means that investors will not make higher return even if they acquire information such as management decisions or intentions. Thus it can be said that a market that is efficient in the strong form will incorporate the features of the semi-strong form and the weak form together.

Implications of Efficient Market

In the efficient market there are some implications that concern both investors and financial managers. It‘s been already explained that investors will not be able gain advantage consistently over the others by getting information about the companies. From the perspective of financial managers, there are important implications that must be considered too.

a) Managers should not waste time hoping to find undervalued company to takeover. We have seen that share prices reflect company value accurately and it is not possible to make profit with this way. Under the strong form of efficiency even inside information will make no use. There must be more persuasive reasons for takeovers.

b) Managers should not seek an appropriate time in order to issue new shares. In the efficient markets, prices always reflect true worth of company regardless of the seasons or months. Therefore managers should believe that share prices cannot be undervalued or overvalued and timing for new shares does not really matter.

c) Mangers should not try to fool the market. Market will never be cheated by any act of managers. The fair value is evaluated and given to shares. If a financial manager decides to give bonus issue to share holders just to imply company has performing well, investors will assess this correctly and price the shares accordingly.

d) Managers should accept the level of the risk evaluated by market. If company has new investments the return value of these investments and the contribution to the company value will be accurately assessed by market. Managers cannot do much about this judgment.

Conclusion

In reality there is no market that completely efficient. If they were efficient all the efforts to outperform the market would be meaningless. In fact what makes a market efficient is that these efforts. Some markets can be more efficient than the others, depending on how fast information spreads and how qualified are the investors. In the age of information news are spreading faster and accurately, leading more efficient markets. Therefore, both investors and financial managers have to accept the facts of the efficient market. Investors must accept that it is becoming harder to beat others using information. And companies cannot ignore the fact that most investors are very intelligent and the companies’ security prices reflect their performance very accurately

Monetary and Fiscal Policies

Governments regulate economic activities to achieve high employment levels, low inflation, stable economic growth and the balance of external payments. The two main tools for this regulation are fiscal policy and monetary policy. Through the fiscal policy, governments manage national income by taxation and spending. And, through the monetary policy, governments control the money supply. Central Banks are appointed for this purpose.

Fiscal policy

"Fiscal policy is the term used to describe all of the government’s decisions regarding taxation and spending". When governments want to increase the money available to populace, they lower the taxes and raise spending (expansionary fiscal policy); in contrast, when they want to decrease the money available to populace, they raise the taxes and lower spending (contractionary fiscal policy).

Transmission Mechanisms of Fiscal Policy

In order to see how the fiscal policy is affecting the national income, we can use gross domestic product (GDP) equation, which will give total value of final goods and services by summing up the expenditures. The result will roughly be equal to the national income. This equation was originally used by Keynes (1936) and he formed the basis of modern macro economy:

Y = C(Y - T) + I + G + NX

,where Y is national income, C is consumption spending, I is investment spending, G is government spending, and NX is net exports. The Consumption is dependent on the income that remains after tax payments (disposable income), so it has Y and T parameters. Another important thing to note is that consumption spending excludes savings or spending from borrowed funds like mortgages.

From the formula above it can be said that when taxes (T) are reduced, assuming Y is stable at the start, consumption (C) increases, causing an increase at national income (Y). Increasing government spending (G) leads an increase at national income (Y) too.

Fiscal policy is the most important tool to affect GDP. The expansionary policy usually yields to greater national income along with higher prices. It is also dependent on the existing state of the economy and the business cycles. If the economy is in recession, expansionary policy revives unused productive capacity and unemployed workers. This will raise the output of economy without changing the price level. If the workers were already fully utilized, same expansionary policy would have more impact on prices rather than output.

Another point is that its impact is not the same on every worker group. Depending on the rational and the aim of the policy, tax cut may affect only on the middle class. And, since it is the largest group, new taxes are introduced on this same class. When it comes to spending, effected worker group is even more specific. Decisions like building a new bridge could only affect people who will work in this industry and the number is very limited. This certainly will not be enough to have an impact on aggregate value of GDP.

Monetary Policy

Monetary policy is simply described as the policies to change the money supply and money supply is "the total amount of currency plus deposits held by the public". Central Banks may follow expansionary fiscal policy by purchasing government bonds, decreasing the reserve requirement, and decreasing the discount rate or may follow contractionary monetary policy by selling government bonds, increasing the reserve requirement, and increasing the discount rate.

Transmission Mechanisms of Money Supply

When central banks sell bonds, currency held by populace is exchanged with bonds resulting in a shrink in the money supply. In the same manner, when central banks purchases bonds, currency flows to populace and money supply increases.

Central banks can also change the reserve requirements ("the percentage of funds that member banks have to maintain on deposit at all times")  If central bank increases the reserve requirement, member banks require holding more reserve and making less loans, resulting in a decrease in money supply. When reserve requirement is decreased, member banks can make more loan and money supply increases.

The last instrument that central banks use is the national interest rate. It is the interest rate charged by a central bank on a loan to a member bank and when it is increased; commercial banks will be less likely to borrow money and will make fewer loans, resulting in a decrease in money supply. When it is decreased, commercial banks are encouraged to make loans and also willing to lend this money to populace. Result is an increase in money supply.

Primary target of the monetary policy is money supply. With an expansionary monetary policy, money supply rises. This pulls the interest rates down, consumer spending rises and new workers will join to economy. However the excess of money will end up with higher inflation, if the economy is running in full capacity. This causes the fall of money value and exchange rate. When the contractionary policy is in operation, interest rates rise, consumer spending falls and inflation abates. If the economy is running under its capacity unemployment problem may emerge.

Having less money than what the economy needs, causing the rise in its value will also encourage populace to purchase goods from overseas and also making difficult for national companies for exporting. This will lead deficit in import-export balance (external payment balance) and this has to be financed by other resources.

Lags in Monetary and Fiscal Policies

Time lags occur between the onset of an economic problem and the full impact of the policy. These lags can be categorized in two main groups which are inside lag (getting the policy activated) and outside lag (the impact of the policy). The inside lags are recognition lag, decision lag, and implementation lag and the one outside lag is impact lag. Monetary and fiscal policies differ in the speed, especially for the inside lags.

Recognition lag is the time to identify the actual problem. It takes time to collect and analyze economic data. For example unemployment and inflation data are usually available one month later and production and income data are reported quarterly or even longer. Once data is accumulated, it must be analyzed and determined that a problem is looming and a decision must be taken.

Once the problem is identified, the course of action needs to be decided. And if this decision is taken by government, there might be necessary to pass legislations, laws or administrative rules, which are usually debated by the parliament to select the most appropriate policies. For example, if expansionary policy will be used, government has to decide whether to go for purchases or transfer payments. If it goes for purchases, then what types of goods or services are purchased? If taxes are decreased, which taxes are cut and who receives the extra income? These decisions could take days, weeks, or months and they constitute decision lag.

Time that is spent to implement selected policy is called implementation lag. For the spending example, appropriate government agencies are contacted. These agencies require bids to identify product suppliers. The recruitment process also contributes to implementation lag.

Inside lags are likely to take several months. A best case scenario involves at least two months. One month to recognize the problem and another month to select and implement the appropriation policy.

Impact Lag is the time it takes for the policy actions to influence the economy and see the results on the producers and consumers.

If we compare the monetary and fiscal policy lags, the impact lag will be similar, since the economy works through itself. Recognition lag will be similar too, because central banks and governments will use the same collected data. However decision and implementation lags differ for monetary and fiscal policies. For the monetary policy, decision lags are relatively short. Central banks are devoted for this and their committee meets very often. Implementation lags are short as well. Once the decision is made, the implementation can start through financial markets in a very short time. Fiscal policy decisions are made by government and it may take a long time for a parliament to come up with a settled decision and also approved by the prime minister.

The implementation lag is likely to be longer since it will comprise government agencies and bureaucracies, which will make sure that all rules and procedures are followed.

Goals of Monetary and Fiscal Policies

It is obvious to think that monetary and fiscal policies will be effective when they share same goals. These goals are usually common for most economies and they can be summarized as sustainable growth and high employment while maintaining stable prices.

Fiscal decisions are taken by governments and they are usually put in to action as a long term objectives. While meeting these objectives, monetary policy can be used to smooth out falls and rises in the short term. For example, when there is a recession, central banks can intervene the economy by lowering interest rates for a quick stabilization, which prevents long run problems, like employment losses. However, prolonging monetary policy may trigger problems like inflation, since there will be excess of money. Therefore monetary policy must be preferred for short or middle term objectives.
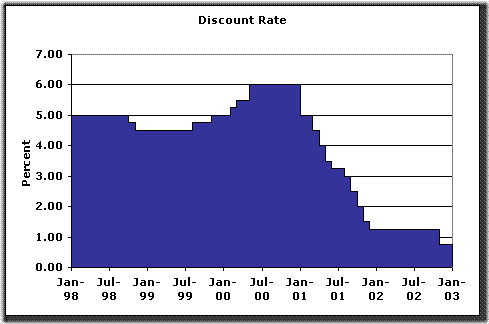
clip_image002

Two examples of government action over interest rates in US took place between 1999 and 2001 as depicted in Figure. In 2001 the Federal Reserve made 11 reductions in the overnight interest rate. These actions were to stimulate growth in the face of a slowing economy. In contrast, in 1999 and 2000 when the economy was experiencing very rapid growth and a potentially unsustainable expansion without an increase in the rate of inflation, the Federal Reserve raised the federal funds to slow down the overheated economy.

The Effectiveness of Monetary and Fiscal Policies

Both policies and their instruments have certain advantages, in terms of speed and effectiveness. Therefore, correct policy must be selected as a main tool by studying the problem and predicting outcomes in the short and long terms.

Among the instruments of monetary policy, open market operations are most common tool. Central banks can quickly exchange money with bonds. For the short term need of money, governments tend to use this tool to finance its budget deficits.

The second widely used tool is national interest rate. However it has a limit and when it hits to zero, it can no more be reduced. Zero-interest rate policy was used in Japan in 1999. In order to stimulate slowing economy, they lowered the overnight nominal interest rate to zero. However, for the stimulation of economy, monetary policy may not be effective alone and must be supported with fiscal policy, so that the burden can be shared. And In this Japanese economy case, the policy did not created the effect as much as expected and the rate was again lowered to zero in March 2001. Economists argue that government should have used more aggressive fiscal policy, even by taking the budget deficit risks.

The reserve requirement is extremely powerful as it may cause huge money flows in the economy and has the risk of rocketing interest rates and the price levels very quickly. So it is used only in the event of serious economic problems.

It is suggested that fiscal policy is more suitable to fight unemployment while monetary policy may be more effective to fight inflation. With the tools of monetary policy and following expansionary policies, it would take longer to sort out unemployment, since it depends on the private sector to launch new investments. However, governments’ certain spending policies like dam construction or road improvement directly opens new vacancies, reducing low employment rates faster. In the case of a fight against inflation, fiscal policies may be on the slow side, whereas monetary policies are able to eliminate the excess of money quickly.

Another reason for the governments to prefer monetary policy to fiscal policies may be based on the political reasons. At the end, fighting inflation requires government to take unpopular actions like reducing spending or raising taxes. Governments, which used fiscal policies, seemed to struggle as it happened in the United States in 1980s.

Conclusion

We have seen that governments can meet their targets by selecting correct policies. Problems must be studied carefully and main policy must be selected accordingly.

In order to be successful, governments’ fiscal policies and central banks’ monetary policies must be in coordination. Monetary policy can be used for quick stabilization, since its management is faster at decision and implementation phases. And also economy’s existing state must be considered to avoid unexpected outcomes. Macro economy management evolved in the last century by taking lessons from the experiences. Today, we have lots of successful examples and we know that through the right policies, economies can stay away from crisis while achieving desirable results.

References

  1. http://www.atozinvestments.com/investing-terms-r.html
  1. http://www.amosweb.com/cgi-bin/awb_nav.pl?s=wpd&c=dsp&k=policy+lags
  1. http://www.ifs.org.uk/economic_review/fp222.pdf.
  1. http://www.bized.ac.uk/current/mind/2003_4/020204.htm
  1. http://www.sparknotes.com/economics/macro/taxandfiscalpolicy/
  1. http://www.frbsf.org/education/activities/drecon/2002/0203.html
  1. http://research.stlouisfed.org/fred2/series/DDISCRT/51/10yrs
  1. http://usinfo.state.gov/products/pubs/oecon/chap7.htm

How to Finance Mergers and Acquisitions

A corporate merger is the combination of the assets and liabilities of two firms to form a single business entity. In everyday language, the term acquisition tends to be used when a larger firm absorbs a smaller firm, and merger tends to be used when the combination is portrayed to be between equals. In a merger of firms that are approximate equals, there often is an exchange of stock in which one firm issues new shares to the shareholders of the other firm at a certain ratio.

Mergers are generally differentiated from acquisitions partly by the way in which they are financed and partly by the relative size of the companies. Various methods of financing an M&A deal exist:

Cash

Payment by cash. Such transactions are usually termed acquisitions rather than mergers because the shareholders of the target company are removed from the picture and the target comes under the (indirect) control of the bidder's shareholders alone.

A cash deal would make more sense during a downward trend in the interest rates. Another advantage of using cash for an acquisition is that there tends to lesser chances of EPS dilution for the acquiring company. But a caveat in using cash is that it places constraints on the cash flow of the company.

To raise cash followings are recommended:

1. Hire a corporate accounting firm to create a comprehensive overall picture of your company's assets and debts. Discuss with them which of your company's assets are no longer necessary or profitable to your business plan.

2. Divest the company of the chosen assets to raise cash to finance your proposed merger or buyout.

Financing

Financing capital may be borrowed from a bank, or raised by an issue of bonds. Alternatively, the acquirer's stock may be offered as consideration. Acquisitions financed through debt are known as leveraged buyouts (only if they take the target private), and the debt will often be moved down onto the balance sheet of the acquired company.

When financing through stock followings are recommended:

1. Hire an investment banking firm to review the target company. Ask them to provide you with an estimate of the true worth of the other company's assets and future profits. You will need this information to decide how many shares of stock and at what price to trade in order to effectuate the merger.

2. Negotiate with the other company for the exact amount and price of shares to be given to shareholders in exchange for ownership of the company.

3. Issue the contracted for amount of shares in your company to the shareholders of the company with which you will merge. In this transaction, you are financing the acquisition of another company by having the target company's shareholders become shareholders in your company.

Hybrids

An acquisition can involve a combination of cash and debt, or a combination of cash and stock of the purchasing entity.

References

1. http://en.wikipedia.org/wiki/Mergers_and_acquisitions

2. http://www.quickmba.com/finance/mergers-acquisitions

3. http://www.ehow.com/how_2119515_finance-buyout-merger.html

Ways to Ensure the Success of Merger

Five Ingredients for Executing a Merger

1. A compelling value proposition

Every merger discussion must begin with a well-articulated value proposition. Both credit union boards and management teams must understand the rationale for the merger and appreciate the tangible benefits—in terms of products, services, rates—that the merger will bring to the members.

2. Open-minded stakeholders

In any merger negotiation, there are multiple stakeholder interests that must be addressed. While what is in the best interests of the members should be the ultimate factor in deciding whether or not to merge, it is often the particular interests of the board and management team that determine the issue.

According to one CEO, it is important to perform a stakeholder analysis to determine who will honestly entertain the idea of a merger and who may oppose the concept. A long-tenured board member, for example, may be more emotionally attached to the concept of credit union continuity despite evidence that a merger would benefit the members. However, sometimes even a long-tenured board member will surprise you and act “as a true steward” in the best interests of the members.

The key to a successful merger negotiation process, says one CEO, is to identify the influential stakeholders on the other side of the table and address their concerns. Once their issues are addressed, they may be able to influence others.

3. Good timing

Timing can be the difference between a successful merger negotiation and a failed attempt. Says the CEO of a small credit union who merged with a larger credit union, “our merger discussions moved quickly because we had been speaking with several other credit unions about a merger. Through the process we had learned a lot about ourselves and knew what was important to us.” By the time the eventual merger party approached the credit union, “our board was receptive to the idea.”

Persistence is one way to ensure that one’s overtures have a better chance of succeeding. According to several CEOs we spoke with, it takes “a lot of leg work” to arrive at the stage where a merger is a realistic possibility. One large credit union stated that it took nearly five years to convince a smaller credit union that a merger was in its best interests.

4. Fair treatment of people

To accomplish a merger, both parties in the negotiation process must come away feeling that a fair outcome was achieved. The concept of “fairness” will vary with each situation. In general, however, the terms of any deal must address the specific interests of the board, provide appropriate remuneration to management, and ensure staff positions will not be eliminated..

With respect to management, most of the credit unions we spoke with developed compensation plans based on the specific situation and skills of each manager. Executives and managers who were approaching retirement or whose service was no longer needed were offered generous retirement packages. Retention bonus packages are often offered to those managers one wishes to retain.

5. Trust & Respect

No merger discussion will succeed without trust and respect. Each party must feel comfortable with the other as a partner and believe that the negotiated terms are made in good faith.

Merger discussions can be complicated affairs and no two negotiations are alike. However, if one can deliver the right message to the right people at the right time and back it up with a fair, believable offer, chances are the merger may succeed.

Other policies to follow for successful merger

Followings are some of the policies that the management of merger companies follow:

  • Retain all employees one year
  • Employees keep salary but may be reassigned duties
  • Employees keep seniority (except in pension) (this will keep long-term employees happy)
  • Keep existing facilities open as long as members support them

Also for bridging the cultural divide between organisations, these people management policies are critical:

  • Pay and benefits
  • Management selection and development
  • Harmonisation and integration of HR practices
  • Employee communication
  • The pace of change

Successful mergers are led by CEOs who share their vision of the new organization and put their personal imprint on people management (Marks and Mirvis, 1997). Based on the literature, the CEO's winning formula is as follows:

  • dedicating executive time and focus
  • putting together a leadership team;
  • focusing management attention on success factors
  • creating a sense of human purpose and direction
  • modeling desired behavior and rules of the road.

References

1. http://www.creditunions.com/home/articles/template.asp?article_id=1927

2. http://www.creditunions.com/home/articles/template.asp?article_id=1152

3. http://www.onrec.com/content2/news.asp?ID=3240

4. Anatomy of a merger: behavior of organizational factors and processes throughout the pre- during- post- stages (part 2);
Steven H. Appelbaum, Joy Gandell, Barbara T. Shapiro, Pierre Belisle, Eugene Hoeven; Management Decision; ISSN: 0025-1747
Year: 2000 Volume: 38 Issue: 10 Page: 674 - 684

Models Used for Exchange Rate Determination

The models that try to explain current value of currency are usually based on simple economic facts. The most prevailing and widely know theory is Purchasing Power Parity (PPP). This theory was first introduced by Swedish economist Gustav Cassel in 1922. Cassel's PPP is based on the law of one price which argues that goods expressed in the same currency should have the same price. This rule allows us to make a direct comparison between different currencies. For example if the price of one barrel of oil is $15 in the U.S. and it is 30CHF in Switzerland then the exchange rate between these two countries should be 0.50 USD/CHF. Therefore spot rate is given by following formula:

St = Poil,US / Poil,SWIT = $15/CHF 30 = 0.50 $/CHF

There is a wide criticism of this version of PPP since it ignores transportation costs, tariffs, or other obstruction to the free flow of trade. Hence the relative version of the PPP has been suggested. Relative PPP states that the rate of change in the prices of products should be similar when measured in a common currency, as long as transportation costs and trade barriers are unchanged. The following formula reflects the relationship between relative inflation rates and changes in exchange rate:

St+T /St = (1 + Id) / (1 + If)

where,

If = (Pf,t+T / Pf,t ) - 1 
(foreign inflation rate from t to t+T)

and

Id = (Pd,t+T / Pd,t ) - 1
(domestic inflation rate from t to t+T.)

Theory of Interest Rate Parity states that the interest rate differential between two countries is equal to the differential between the forward exchange rate and the spot exchange rate. Interest rate parity plays an essential role in foreign exchange markets, connecting interest rates, spot exchange rates and foreign exchange rates. The relationship can be seen when you follow the two methods an investor may take to convert foreign currency into U.S. dollars. Option A would be to invest the foreign currency locally at the foreign risk-free rate for a specific time period. The investor would then simultaneously enter into a forward rate agreement to convert the proceeds from the investment into U.S. dollars, using a forward exchange rate, at the end of the investing period. Option B would be to convert the foreign currency to U.S. dollars at the spot exchange rate, then invest the dollars for the same amount of time as in option A, at the local (U.S.) risk-free rate. When no arbitrage opportunities exist, the cash flows from both options are equal.

A Theory of Foreign Exchange Rates that states that the expected Future spot foreign Exchange rate t periods from now equals the current t-period forward exchange rate. This theory simply asserts that forward rates exclusively represent the expected future rates.

There is another important theory called as the International Fisher Effect (IFE) named after the economist Irving Fisher. It uses nominal interest rate differentials rather than inflation rate differentials to explain exchange rate movements, but it is closely related to the PPP theory because nominal interest rates are highly correlated with inflation rates. It states that in the long run, inflation and nominal interest rates move together, implying that real interest rates are stable in the long term. The change in the spot exchange rate hence given by the following equation:

St+T /St = [1 + id(T/360)] / [1 + if(T/360)]

where,

if = foreign interest rate for T days;
id = domestic interest rate for T days.

Another approach is Balance of Payments (BOP) which sees foreign currency as the price of any commodity. In the simplified version of BOP the capital account of a country is defined as the difference between exports and imports as follows:

CA = X - M

where, X is exports and M is imports.

In general, at higher real exchange rates we should expect more exports and fewer imports, and higher current account surpluses; while at lower real exchange rates, the opposite should occur. According to the balance of trade approach, the exchange rate moves in the required direction to compensate a trade imbalance. For example, suppose the trade balance is in equilibrium. An increase in domestic income leads to an increase in demand for imports causing a trade deficit. Then, we should expect the exchange rate to depreciate to correct this imbalance. Using a similar argument, we should also expect a depreciation of the domestic currency, following an increase in domestic prices, a decrease in foreign prices, or a decrease in foreign income.

In the Monetary and Portfolio Approaches, exchange rate movement is thought to eliminate any monetary disequilibrium resulted from changes in money supply and demand. In the pure monetary approach following equation is used to explain to exchange rate behavior,

MS V = P Y

where, V is the velocity of money, P is the price level, Y is real output and MS is the supply for money, Using this equation with the PPP theory one can simply drive the following to explain spot rate changes:

St = (Vd/Vf) x (Yf/Yd) x (MSd/MSf)

Taking an example of an increase at domestic money supply (MSd) as oppose to foreign money supply (MSf), one can expect an increase in the spot exchange rate.

The portfolio approach expands the monetary approach by including other financial assets. The portfolio approach postulates that in addition to the domestic money supply, the exchange value is determined also by domestic and foreign financial securities. In this approach, the wealth (W) is distributed across money (M) holdings, domestic bonds (B), and foreign bonds (B*), which is expressed by following formula:

W = M + B + SB*

Supposing the monetary authorities decide to increase the money supply, the domestic interest rate falls. With a lower interest, households are no longer satisfied with their portfolio allocation. The demand for domestic bonds falls relative to other financial assets. Households shift out of domestic bonds. They substitute into domestic money and foreign bonds. Because of the increase in demand for foreign bonds, the demand for foreign currency rises. All other things constant, the increased demand for foreign currency causes the domestic currency to depreciate.

All the theories above simply try to explain the movements in the exchange rate basing on the rule that economies are tend to balance back to equilibrium point in response to the drifts at any particular economic parameter. The movement towards the equilibrium point is the result of the actions of traders who are buying and selling currencies for arbitraging purposes. We will now see whether these theories can be utilized for forecasting purposes.

How to Reduce Foreign Exchange Exposure

The risk posed by foreign exchange transactions stems from the volatility of the exchange rate, the volatility of the interest rates, and factors unique to individual companies which are interrelated. To protect and hedge against adverse currency and interest rate changes, multinational corporations need to take concrete steps for mitigating these risks.

Another option to minimize unfavorable foreign exchange rates is to develop a strategy to hedge foreign currency exposure. By hedging, your company is essentially taking out an insurance policy against a negative event. While hedging will not prevent a negative event from happening, it can reduce or eliminate the impact of the negative event if it occurs.

The following are some of the most common types of foreign currency hedging vehicles used in today's markets as a foreign currency hedge. While retail forex traders typically use foreign currency options as a hedging vehicle. Banks and commercials are more likely to use options, swaps, swaptions and other more complex derivatives to meet their specific hedging needs.

Forward Contracts - A foreign currency contract to buy or sell a foreign currency at a fixed rate for delivery on a specified future date or period. Foreign currency forward contracts are used as a foreign currency hedge when an investor has an obligation to either make or take a foreign currency payment at some point in the future. An advantage of the forward contract is that it removes the impact of foreign exchange volatility on the profit or cost of a future transaction. Once the rate has been agreed upon, your company is protected from all future exchange rate fluctuations. A disadvantage of the forward contract is that it removes the opportunity to enjoy upside potential if the rate is more favorable for your company.

* Important: Please note that forwards contracts are different than futures contracts. Foreign currency futures contracts have standard contract sizes, time periods, settlement procedures and are traded on regulated exchanges throughout the world. Foreign currency forwards contracts may have different contract sizes, time periods and settlement procedures than futures contracts. Foreign currency forwards contracts are considered over-the-counter (OTC) due to the fact that there is no centralized trading location and transactions are conducted directly between parties via telephone and online trading platforms at thousands of locations worldwide.

Foreign Currency Options - A financial foreign currency contract giving the buyer the right, but not the obligation, to purchase or sell a specific foreign currency contract (the underlying) at a specific price (the strike price) on or before a specific date (the expiration date). The amount the foreign currency option buyer pays to the foreign currency option seller for the foreign currency option contract rights is called the option "premium."

A foreign currency option provides protection from an adverse exchange rate movement, while enabling the owner of the option to benefit from favorable movements. The key characteristic of a foreign currency option is that it is a right rather than an obligation. A disadvantage of an option is that it requires a premium to be paid at the time the option is purchased.

Interest Rate Options - Similar to foreign currency options, however interest rate is used instead of foreign currency.

Foreign Currency Swaps - A financial foreign currency contract whereby the buyer and seller exchange equal initial principal amounts of two different currencies at the spot rate.

Interest Rate Swaps - A financial interest rate contracts whereby the buyer and seller swap interest rate exposure over the term of the contract. The most common swap contract is the fixed-to-float swap whereby the swap buyer receives a floating rate from the swap seller, and the swap seller receives a fixed rate from the swap buyer.

Spot Contracts - A foreign currency contract to buy or sell at the current foreign currency rate, requiring settlement within two days. As a foreign currency hedging vehicle, due to the short-term settlement date, spot contracts are not appropriate for many foreign currency hedging and trading strategies. Foreign currency spot contracts are more commonly used in combination with other types of foreign currency hedging vehicles when implementing a foreign currency hedging strategy.

Example 1

Tennspo Ltd buys goods from a Norwegian supplier on 2 January 2005 for Norwegian krone (NOK) 1 million. The NOK 1 million is payable on 31 March 2005. At 2 January, the exchange rate is NOK 12.50/£.
On 2 January, the company enters into a forward contract to buy NOK 1 million, for delivery on 31 March, at a forward rate of NOK 12.80/£. It therefore knows that, whatever the spot rate on 31 March, it is going to have to pay £78,125 (1 million/£12.80) to settle the liability.

Example 2

The facts are as in example 1, except that the company accounts for the purchase and the forward currency contract separately. The exchange rate at 31 March is NOK 13.00/£.
The NOK 1 million debt that the company incurs on 2 January is valued at £80,000 on that date, but it only costs the company £78,125 to settle it on 31 March. An exchange gain of £1,875 therefore arises.

Risks of Raising Investment Funds from Multinational Resources

All companies face certain risks regardless of they are national or multinational statuses. These common risks are explained in another post. In addition to them followings apply particularly to multinational companies.

Tax Scheme on Host Country: Different tax rules apply on different countries. Having different tax rules in different countries will have companies to recalculate their leverage ratios. Higher taxes means that companies would prefer debt resources than the equities as debt is perceived as tax shield.

Weighted Average Cost of Capital: One other element which is being affected is the cost of capital. The weighted average cost of debt has two components tax and debt ratio (usually an interest rate on the loan company is liable to pay). Having different tax ratios will result in different cost of debt. As the corporate taxes are increased company face less weighted average cost of debt. There are studies which have revealed that multinational companies facing higher cost of capital up to 20% than the domestic ones. See this for more information.

Imputation Scheme: Multinationals also have to think about the imputation scheme of their operating countries.

Most companies using equities to fund their investments have to share some of their profits to their shareholders. The general rule is that companies pay their taxes first and then distribute their profits in the form of dividends to the shareholders. Shareholders then pay tax on the income they receive. Because tax has already been paid on the earnings of the company by the company itself, this is, in effect paying tax twice or double taxing.

The idea of being able to claim imputation on personal income tax is designed to prevent the double taxing of income.

Imputation credits represent the underlying tax paid by a company on the pre-tax profits from which the dividends were paid. Individual shareholders that receive dividends may use the tax paid by the company to eliminate double taxing on the dividends they earn. This means, that when a shareholder received fully franked or partly franked dividends he/she can claim a franking rebate for the tax already paid by the company issuing the dividend.

Imputation scheme differ from country to country, for example US has no imputation scheme at all. Shareholders will have different incentives when they have different imputation schemes. This may also change multinational companies to use different strategies to attract investors with different expectations.

Cost of Transferring Funds: Companies should take into account the cost of transferring funds between parents and their subsidiaries. In some cases parent company may want to pull out of some cash from its business units in another company. In such cases the parent must first determine if the cross-border arbitrage makes financial sense to the organization as a whole. The management team has to consider, for example, whether repatriation taxes* negate the benefit of a cash transfer; if cash transfer is cheaper than borrowing domestically; and what kind of currency risk is involved in the transfer.

Ecological Risks: There are substantive changes companies can make that should help to avoid them from disruption by the ecological risks. A large multinational corporation should weigh the benefits achieved through current economies of scale against the expected value of locating supplies, production, and customers as close together as possible and practical.

The same is true of companies that depend on outsourced production facilities in distant places. While these manufacturing and distribution strategies are currently cheap, this may not prove true as climate change disruptions cause delays, unintended consequences, or inability to complete a contract.

Labouring: Multinationals pay higher wages than host-country companies in both industrialized and developing countries, and when multinationals acquire host country businesses, they institute changes in production methods and human resource management practices that raise productivity sufficiently to support higher wages.

*Repatriation Taxes: taxes paid when remitting cash flows from a foreign affiliate to the parent firm.

References:

  1. Managing Ecological Investment Risk
  2. Multinational Corporations and Labor Conditions. Flanagan, Robert J. Source: Globalization and Labor Conditions, August 2006 , pp. 118-146(29)

Tax Effect on a Corporate's Financial Policy

Financial policy is the criteria describing a corporation's choices regarding its debt/equity mix, currencies of denomination*, maturity structure*, method of financing investment projects, and hedging decisions with a goal of maximizing the value of the firm to some set of stockholders.

The Modigliani-Miller Theorem comprises four distinct results from a series of papers (1958, 1961, 1963). The first proposition establishes that under certain conditions, a firm’s debt-equity ratio does not affect its market value. The second proposition establishes that a firm’s leverage has no effect on its weighted average cost of capital (i.e., the cost of equity capital is a linear function of the debt-equity ratio). The third proposition establishes that firm market value is independent of its dividend policy. The fourth proposition establishes that equity-holders are indifferent about the firm’s financial policy.

Miller and Modigliani (1963) and Miller (1977) showed that under some conditions, the optimal capital structure can be complete debt finance due to the preferential treatment of debt relative to equity in a tax code. For example, in the U.S. interest payments on debt are excluded from corporate taxes. As a consequence, substituting debt for equity generates a surplus by reducing firm tax payments to the government. Firms can then pass this surplus on to investors in the form of higher returns. This raised the further provocative question – were firms that issued equity leaving stockholder money on the table in the form of unnecessary corporate income tax payments? Miller (1977) resolved this problem by showing that a firm could generate higher after-tax income by increasing the debt-equity ratio, and this additional income would result in a higher payout to stockholders and bondholders, but the value of the firm need not increase. The crux of the argument is that as debt is substituted for equity, the proportion of firm payouts in the form of interest on debt rises relative to payouts in the form of dividends and capital gains on equity. Higher taxes on interest payments than on equity returns reduce or eliminate the advantage of debt finance to the firm.

As a common conception, debt has tax advantages at the corporate level because interest payments reduce the firm’s taxable income while dividends and share repurchases do not.  Unless personal taxes negate this advantage, interest ‘tax shields’ give corporations – that is, shareholders – a powerful incentive to increase leverage.

The trade-off theory of capital structure is largely built upon the tax benefits of debt. In its simplest form, trade-off theory says that firms balance the tax benefits of debt against the costs of financial distress. (Leverage might also affect agency conflicts among stockholders, bondholders, and managers.) Tax effects dominate at low leverage, while distress costs dominate at high leverage. The firm has an optimal, or target, debt ratio at which the incremental value of tax shields from a small change in leverage exactly offsets the incremental distress costs.

*Denomination is a proper description of a currency amount, usually for coins or banknotes.

*Maturity Structure is the profile and length of time to the redemption and repayment of a company's various debts.

Weighted Average Cost of Capital

The cost of capital for a firm is a weighted sum of the cost of equity and the cost of debt.

WACC = weighted cost of debt + weighted cost of equity 

This rate is also known as the Hurdle Rate or Discount Rate. In the definition above, equity can also be broken down into more detailed components as: retained earnings, common stock, preferred stock. The components of a capital can be listed as follows:

  • Retained Earnings - Profit the company makes, but does not give to the shareholders in the form of dividends.
  • Common Stock  - A security that represents ownership in a corporation.
  • Preferred Stock  - A class of ownership in a corporation that has a higher claim on the assets and earnings than common stock.
  • Bonds (debt)

The cost of capital is an opportunity cost of finance, because it is the minimum return which an investor requires. For shareholders it is the dividend they expect to receive plus a capital gain on the value of their shares, while for loan holders it is the rate of interest which is quoted on the loan.

For an investment to be worthwhile the expected return on capital must be greater than the cost of capital.

Usually all the equity cost components are represented in a single value as rE. Following is after tax WACC equation:

                D       E
WACC = rD(1-Tc)--- + rE---
                V       V
 
  • D and E are market value of the firms debt and equity
  • Tc marginal corporate tax rate
  • rD and rE are cost of debt and equity

Cost of equity rE is the rate that investors expect as a rate of return (expected equity return). And for rD, interest rate or coupon rate is used.

Following is a sample break down of a company's costs.

Capital Component Cost Times % of capital structure Total
Retained Earnings 10% x 25% 2.50%
Common Stocks 11% x 10% 1.10%
Preferred Stocks %9 x 15% 1.35%
Bonds 6% x 50% 3.00%
TOTAL   x   7.95%

Sum of all weighted costs give the WACC as 7.95%.

WACC (Weighted Average Cost of Capital) is used to see if certain intended investments or strategies or projects or purchases are worthwhile to undertake.

WACC is expressed as a percentage, like interest. So for example if a company works with a WACC of 12%, than this means that only (and all) investments should be made that give a return higher than the WACC of 12%. The cost of capital for any investment, whether for an entire company or for a project, is the rate of return capital providers would expect to receive if they would invest their capital elsewhere. In other words, the cost of capital is an opportunity cost

Example: suppose this company: The Market value of debt = € 300 million. The Market value of equity = € 400 million. The Cost of debt = 8%. The Corporate Tax rate = 35%. The Cost of equity is 18%.

Cost of debt = 8% x (1-35%) x 300/700  = 0.022

Cost of equity = 18% x  400/700 = 0.102

WACC = 12.5%

There is also another way of calculating cost of equity using CAPM approach as

Cost of equity = Risk-Free-Rate + (Beta x Market-Risk-Premium).


Detailed Analysis of Cost Components

Cost of Retained Earnings

This is kind of weird to think about. It takes some time to understand so take it slowly. After a company makes money (earnings), who owns that money? The shareholders, right? But when you retain earnings you are not giving the money to the shareholders. You are keeping it. In a way, you are investing it for them in your company. Well those shareholders want some return on that money you are keeping.. How much return do they expect? They want the same amount as if they had gotten the retained earning in the form of dividends, and bought more stock in your company with them. THAT is the cost of retained earnings. You as a financial genius, have to ensure that if you are retaining earning, that the shareholders will get at least as good a return on the money as if they had re-invested the money back into the company.

Cost of Issuing Common Stock

Flotation Cost of Common Stock = Costs of issuing the actual stock (ink, printing, paper, computers, etc.) + The cost of retained earnings.

Cost of Preferred Stock

This is another item which is easy to calculate:

Cost of Preferred Stock = (Dividend) / (Stock Price - Underwriting Costs)

Ex: If Company A issues preferred stock, it will pay a dividend of $8 per year and it should be valued at $75 per share. If flotation costs amount to $1 per share cost of preferred stock:

= $8 / ($75-$1) = 10.81%

Cost of Bonds (debt)

The easy part of WACC is the debt part of it. In most cases it is clear how much a company has to pay their bankers or bondholders for debt finance.

Cost of Debt = Coupon rate on the bonds (or interest rate of company's debt) - The Tax Savings

Ex: If Company A issues $1000 par, 20 year bond paying the market rate of 10% and coupons are annual and flotation cost is $50 per bond pre-tax and after-tax cost of debt is:

$1000-$50 = 100 x PVIFA(20,kd) + 1000 x PVIF(20,kd)

kd = 10.62% (Pre-tax cost of debt)

Kd = kd(1-T) = 10.61%(1-.34) = 7% (After-tax cost of debt)

Notes:

PVIFA (Present Value Interest Factor of Annuity)

PVIFA(k,n) = [1-(1+k)^-n]/k

Par Value of Bond (Face Value): This is the amount of money a holder of bond will get back once bond matures.

Tax effect on financial decision

Companies may have an advantage of lowering cost of capital by choosing right capital structure. The obvious advantage is rooted from the fact that interest (debt) is paid before taxes. Following example illustrates this advantage:

with stock

with debt

EBIT 400,000 400,000
- interest expense (50,000)
EBT 400,000 350,000
- taxes (34%) (136,000) (119,000)
EAT 264,000 231,000
- dividends (50,000)
Retained earnings 214,000 231,000

It appears that when investments are financed through debt there is less earnings left after tax. However companies usually have the commitments to pay dividends to the stockholders when they use equities rather than debt. This dividend is paid after taxes. So companies face more cost in that case.

It is worth to remember that weighted cost of debt has two components as debt ratio rD and tax Tc.

                                  D 
Weighted Cost of Debt = rD(1-Tc)---
                                  V 

The implication of this equation is that if corporate taxes are increased , managers will have more reason to shift out of equity funding as the weighted average of debt falls.